


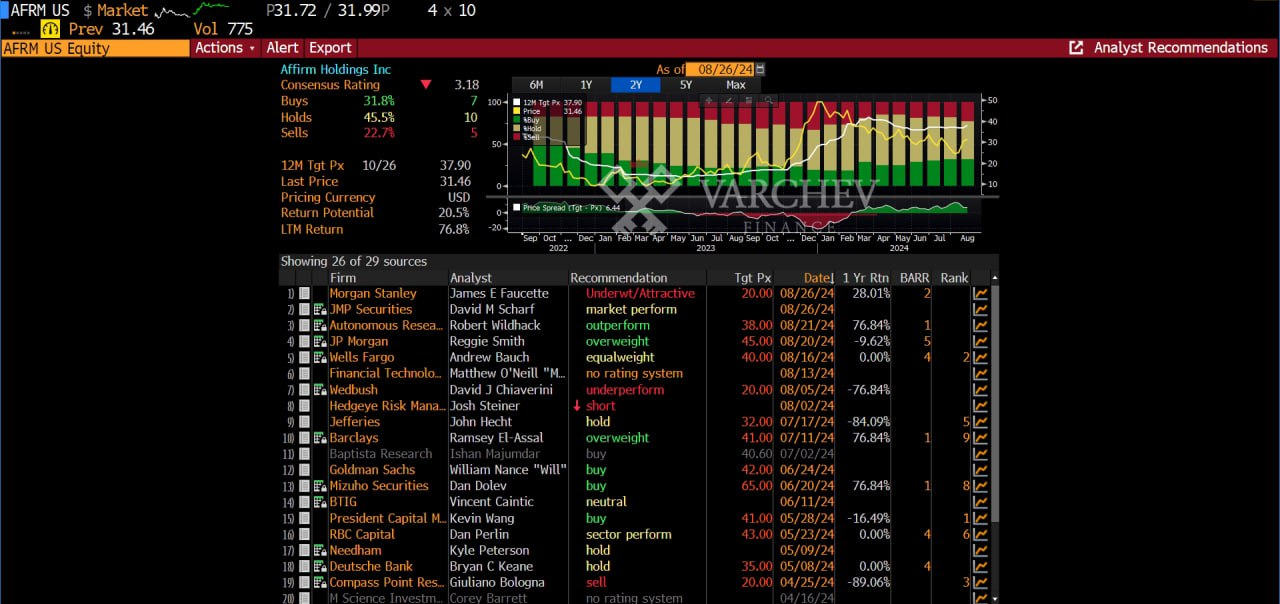
Post Views: 382 AFRM Daily Technical Picture: Correction of the downward trendDeMarker breaks into overbought, indicating the exhaustion of the corrective impulseSequential forms a 9, which also signals the exhaustion of the corrective impulsePrice action shows three consecutive days of increases, reflecting positive sentiment among investorsBreak above 65 SMABreak above 23.6 FIBO In Conclusion: Currently, the price does not suggest a long position from current levels, as the short trend is still in effect. If the price breaks and retests the main trend line in the $32 zone, I will look for a price action signal to position long. Alternatively: If the price breaks below the 23.6 FIBO and 65 SMA in the $29.6-$29.3 zone, the downward impulse will likely…
Varchev Absolute Trader
борсова платформа
- Търгувай над 3000 финансови инструмента: Crypto, Форекс, Акции, Индекси, Суровини, ETF-и
- Използвай платформа с директно изпращане ордерите на борсите
- Cloud base платформа - твоят трейдинг сетъп на всяко устройство
- Market Sentiment - търгувай с настроенията на инвестиционите банки
- Top movers - най-горещите трейдове във всеки един момент
- Stocks scanner - филтрирай най-подходящите за твоя трейдинг стил пазарни инструменти
- Heat map - Търгувай в посоката на големите играчи
Meta Trader 5
- Търгувай Crypto, Форекс, Акции, Индекси, Суровини - всичко на едно място
- Автоматизирана търговия с интелигентни стратегии и роботи (Expert Advisors)
- Разширен технически анализ с хиляди индикатора и инструменти
- Сигурност и стабилност – платформа, доверена от милиони по света
- Нулев марджин при насрещни/хеджирани позиции
- Без комисиона при търговия със CFDs
- Светкавично изпълнение на сделките
Read more:


Login to comment
Comments:
Leave a comment